The Punctured Hot Air Balloon
AROUND 2004 the Indian economy finally seemed to take off – like a huge Dreamliner – and in three years reached the zenith of around 9 per cent plus growth rate. In 2008 it seemed to be passing through an air pocket and experienced a rude shiver, but somehow managed to get out of it. But the respite proved to be short-lived. By 2011 it was coming down, like a leaky hot air balloon. The descent, unlike the sudden crash of the US economy in 2008, was slow but sure.
In the Throes of Stagflation
The deadly combination of stagnating growth and persistently high inflation makes India a particularly negative story among emerging economies. While GDP growth rate remains below 5%, with industrial production in the organised sector contracting by 1.8% during October 2013 compared with the corresponding month of the previous year, the month-on-month retail price inflation touched 11.24 per cent in November 2013. In both cases, most disturbing was the element of consistency: October was the 12th consecutive month showing poor industrial growth, while the rate of retail inflation had been rising continuously from its already high level of 9.52 per cent in August 2013. Worse still, inflation was no more restricted to food items but was visible in both manufacturing and services.
Seen against the 9% average of 2003-08 and the initial aspiration of 9% plus for the 12th plan (2012-2017) period, the growth figures are extremely disappointing. That this is a consistent trend will be evident from the following summary of the growth profile made available by the Central Statistical Office on 31 May 2013.
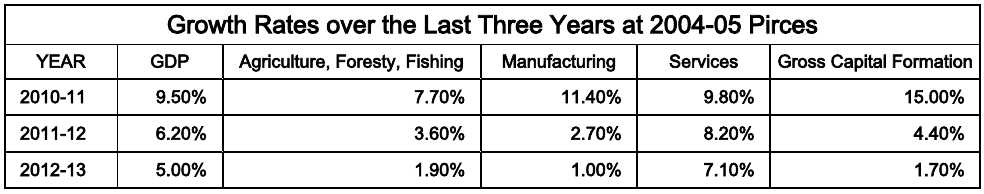
Most worrisome perhaps is the rapid decline in the growth of gross fixed capital formation: from 15.0% in 2010-11 to 4.4% in 2011-12, and to 1.7% in 2012-13. This seems to suggest that a real turnaround is not likely any time soon.
The Plummeting Rupee
Continuing its steady decline over the past one year and more, the rupee breached the “psychological benchmark” of Rs 60 to the dollar on June 26, touching an all-time low of Rs. 64.13 to the dollar on August 20, before settling down to Rs 63.25 at the end of the day. The same day in August it also breached the Rs.100 to the British pound benchmark and the euro too jumped to Rs 84.66 (from Rs 69.77 on April 2) to the rupee. On August 28 it hit a new record low of 68.85 against the dollar. Since then it has been hovering around Rs 61- 63 to the dollar, which is still about 12-14 per cent lower compared to last year.
The government, of course, is putting up a brave face. It seeks to hide the fact that the weakness of the Indian currency is not a passing shadow, that it is a reflection of the country’s bad economic performance in an overall sense as expressed in so many indices like the sharp fall in GDP growth rate.
In a more direct or immediate sense, the nosedive in the value of rupee stemmed from the widening current account deficit (CAD) on India’s balance of payments (BoP) on one hand and the burgeoning external debt on the other, both of which contribute to dwindling international investor confidence and had already provoked an exodus of foreign investment. The number of PE (private equity) investors in India from abroad has shrunk by 20% over the last two years. In FY (financial year, which is counted in India from April to March) 2012-13, Foreign Direct Investment (FDI) was down 38 percent from 2011-12. As per the simple rule of demand and supply, the short supply of the dollar – the international currency – makes it dearer in rupee terms, while increased speculative activities on the currency markets in crisis periods make matters worse.
As for the galloping CAD, two major factors are notable. First, a near 90% jump in annual gold imports (this by itself is suggestive of an economy in doldrums, because the yellow metal has always been the preferred asset of wealth-holders in times of extreme uncertainty) was one of the main causes for the trade deficit rising to $20.1 billion in April this year from $16.9 billion in May last year. The second factor is our huge oil import bill. With more than 80% of the oil requirements being imported, depreciation of the rupee is putting tremendous pressure on the national exchequer, which is, of course, being transferred to the common man in the form of higher oil and gas prices. Moreover, fuels being a universal intermediate, the higher prices of fuels enter into all other prices directly in production costs and also by affecting transport costs. It not only hits the common person with skyrocketing prices, but raises the prices of Indian exports too. So the expected advantage of a depreciated rupee in terms of export growth accrued to India only belatedly and partially. The net result was that India’s CAD increased sharply from less than 1% of GDP in the first half of the 2000s to 2.7% in 2010-11 to 4.2% of GDP in 2011-12, and to 5.1% in 2012-13. This is much higher than the 3% (of GDP) recorded in 1990-91, i.e., at the time of the crisis of 1991.
Another proximate reason why the rupee declined so sharply was the US Federal Reserve’s hint in early June this year that it could roll back its monetary stimulus, i.e., easy credit policy. For India the implication was that this would make external commercial borrowings (ECBs) much more costly for the Indian corporate houses and will harm foreign investors too. This possibility intensified speculative pressure on the rupee and, as noted above, pushed it beyond the Rs 60 benchmark. When, on July 11, the US Federal Reserve Chairman Ben Bernanke made a reverse comment to the effect that the state of the US economy won’t allow him to withdraw the easy money policy immediately, the rupee recovered to 59.32 per dollar. A second hint of monetary tightening in mid-August provoked the till then biggest fall of the rupee in currency markets as noted above.
But how does the appreciation and depreciation of the Indian currency relate to the US monetary policy? Actually what has been happening for quite some time, particularly since the abolition of capital gains tax in the 2003-04 budget, is this. Foreign Institutional Investors (FIIs) borrowed in dollar markets, where liquidity was in abundance and interest rates very low, and invested in stocks and commodity markets and real estates in developing countries, where returns were high, so as to earn huge profits by borrowing cheap and getting higher returns on these investments. The Indian government relied on these foreign investments to balance the CAD and support the rupee. During 2003-08, capital inflows averaging $45 billion per year easily wiped out the up to $15 billion CAD and exerted upward pressure on the rupee. It began to appreciate, reaching a record high of less than Rs.40 to the dollar in April 2008, and the Sensex too shone brilliantly thanks to enhanced inflows of footloose finance capital.
In the wake of the global financial crisis, however, international players found it necessary to book profits by selling their stakes in Indian markets and take the money out of this country to meet other obligations. This contributed to a drop in Sensex, declining GDP growth rate and a depreciating rupee, which fell to Rs.52 to the dollar in just one year, that is, by March 2009. Since then the downward trend in the exchange value of rupee has continued.
Faultlines of Footloose Foreign Capital
“Even as the CAD has been high, we have been able to finance it because of a combination of ‘push’ and ‘pull’ factors. On the push side is the amount of surplus liquidity in the global system consequent upon the extraordinary monetary stimulus provided by advanced economy central banks.... In trying to finance such a large CAD, we are exposing the economy to the risk of sudden stop and exit of capital flows. This will be the case to the extent capital flows in pursuit of short-term profits. Should the risk of capital exit materialise, the exchange rate will become volatile causing knock-on macroeconomic disruptions.”
D. Subbarao: “India’s Macroeconomic Challenges: Some Reserve Bank Perspectives”, RBI Bulletin, April 2013 (emphasis added)
In the era of global integration of financial markets, the inflow of finance capital thus depends considerably on the US credit/ monetary policy – going down when credit gets or is likely to get tighter and rising when there is abundant liquidity. Depending on these volatile flows can be dangerous, as the RBI pointed out early last year (see box).
In plain English, with a possible drying up of unpredictable in-flows, our country may find itself without the wherewithal to absorb the huge deficit and therefore in the grip of a sovereign debt crisis as experienced by Greece.
Anyway, from the extremely abnormal height of 6.5 per cent of GDP in Q3 of 2012-13, CAD came down to a still quite uncomfortable 3.6 per cent in Q4. There were several reasons behind this. As the RBI’s Financial Stability Report (FSR) released on 30 December 2013 observed, the delay in tapering in the U.S. Federal Reserve’s bond purchase programme allowed India to bring about adjustment in CAD and build buffers by replenishing its foreign exchange reserves. In the second half of 2013 the import duty on gold was increased from 6% to 8% and then to 10%, resulting in a decrease in import. Thirdly, as mentioned above, to a limited extent the weak rupee helped boost exports while a sluggish economy dampened growth in imports.
Mounting Foreign Liabilities
Coupled with the plummeting currency, another major concern is our growing external debt, which rose to $390 billion as of March 31, 2013 showing a 12.9% increase over the level at end-March 2012. The external debt to GDP ratio increased to 21.2 per cent at end-March 2013 from 19.7 per cent at end-March 2012. By end-September 2013 external debt just crossed the 400 billion mark.
In end-March 2012, India’s foreign exchange reserves covered 85.2% of our external debt; exactly a year later, it covered only 74.9% and dropped further to 69.3% at end-September. Nearly half of it ($172) consists of short term debt maturing around March next year. This is more than thrice the figure ($54.7 billion) in March 2008.
An important cause of this surge in short term external debt is large-scale borrowings (mostly debts of 5 to 7-years maturity) by Indian corporates at very low interest during the boom years of 2003- 2008. What the declining rupee means for these corporate borrowers is that they will have to pay back much more in rupee terms for every dollar they had borrowed. Naturally, they have pressed the panic button, which has set the alarm bells ringing in the corridors of power.
From the national perspective, no less worrisome are our net external liabilities, i.e., international assets (India’s loans to others and its investments abroad) minus international liabilities (India’s external debt and foreign investment in India). This figure has grown dramatically from $66.6 billion in March 2009 to $282 billion by December 2012 – a fourfold increase in less than four years! The servicing of the fresh foreign liabilities adds to the current account deficit, which may necessitate even larger capital inflows in the next round.
But we have ‘adequate’ foreign exchange reserves vis-à-vis our foreign debt, ministers and officials never tire of assuring us. What they do not say is that these reserves have been built up from inflows of foreign debt and investment, on which India pays high returns; whereas the reserves have to be invested abroad in secure assets such as US government debt, on which India earns very low returns. As N.K. Chandra pointed out in 2008, the net annual drain on account of foreign investment and debt by end-2007, as a percentage of India’s annual national income, was comparable to the percentage drained annually from India under the British Raj.
Skeletons in Bank Vaults
In the US and other advanced nations, reckless business practices of ultra-greedy financial institutions led to a banking crisis in 2007-08, which then metamorphosed into a recession. In our case it is the economic downturn that has put the banking system under severe stress today. It now transpires that the banks – public sector banks (PSBs) in particular – have been lending irresponsibly to big private entities and showing excessive leniency in recovering the loans and interests. The upshot has been a huge growth in non-performing assets (NPAs) and restructured accounts (cases where repayment of the principal and/or the rate of interest have been rescheduled to help the borrower) of Indian banks, with huge outstanding dues from the power, real estate, textiles and infrastructure sectors.
The overall picture is captured in the box below, but let us first look at a couple of specific cases.
Punjab National bank saw its bad loans rise by 4035 crore, or 40%, in the quarter ended December 31, 2012 while bad debts of Indian Overseas Bank rose by about 20%. The net profit of the latter shrank by 88 per cent to Rs 59 crore for the quarter ended March 31, 2013, against Rs 529 crore in the corresponding quarter last year. The decline was an outcome of provisioning for bad and doubtful debts and restructured/stressed accounts. During 2011-12, total NPAs of PSBs as a whole grew by Rs.39000 crore compared to only Rs.5000 crore in the case of private banks. State Bank of India’s gross bad loans increased to 5.56% of its total loans as of June 30 last year
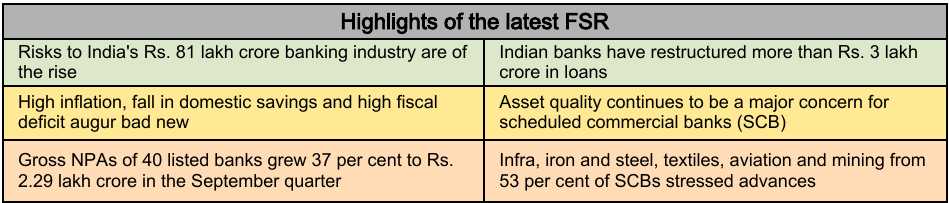
As the Reserve Bank of India’s latest Financial Stability Report (FSR) released on 30 December 2013 pointed out, Banks are more at risk now than six months ago with a jump in both bad debts and restructured loans. Loans worth Rs 74,000 crore for 77 customers have been recast by the corporate debt restructuring (CDR) cell in the 12 months to December 2013, the largest amount reworked in any year. At Rs 3.25 lakh crore, the total stressed advances ratio rose significantly to 10.2 per cent of total advances as at end September 2013 from 9.2 per cent of March 2013. Moreover, inter-linkages among banks heighten the risk of what is called the contagion effect, where even one large house failing to honour its commitment might cause havoc in the entire banking system. The RBI also admitted that part of the problem was banks’ large exposures to big corporates. In sum, Indian banks which were small but less risk-prone compared to their huge Western counterparts, are rapidly shedding that distinction as they grow bigger.
Kingfisher, Deccan Chronicle and Sahara: Upstarts Going Down
Rapidly rising NPAs and restructured loans (RLs) on banks’ books are also expressed as alarming loan burdens on business houses. The case of Kingfisher Airlines Ltd. (KAIR) is telling. The carrier is controlled by billionaire Vijay Mallya, who was elected to the Rajya Sabha in 2002 and 2010 as an independent candidate from his home state of Karnataka. He received several awards both in India and overseas including the “Entrepreneur of the Year” at The Asian Awards, 2010. Ironically, that very year his airline was on the verge of collapse. He managed to avoid that by restructuring the 77.2 billion rupees of debt KAIR had run up buying airliners and adding routes during the economic boom. In April 2011 a significant part of the loans was converted into a 23 per cent equity stake in the airline, in order to reduce its interest and amortisation payment commitments. Very soon the carrier’s equity became almost worthless, inflicting a huge loss on the lenders. Yet the latter generously restructured the loans, offered better terms, extended repayment periods, and provided more credit to keep the unit afloat. A classic case of what economists call sending good money after bad!
With its financial situation going from bad to worse, in October 2012 the airline grounded its entire fleet after pilots went on strike to demand seven months of unpaid salaries, even as the company engaged itself in an out-of-court loan-restructuring process. Towards the end of the year he made news again by presenting three kilograms of solid gold to a temple as puja offering although he was not paying his Kingfisher employees their overdue salaries.
In February 2013, after a lot of legal wrangling, the lenders embarked on the way to liquidate the collateral and guarantees provided by the borrower to recover as much of their loans as possible. The process continues and it seems only a fraction of the sum involved will be ultimately recovered.
Another example of near-bankruptcy is the Deccan Chronicle Holdings Ltd (DCHL), better known as the owner of the newspaper Deccan Chronicle, erstwhile IPL cricket team Deccan Chargers, papers like Asian Age and Financial Chronicle as well as several other businesses. DCHL availed loan and credit enhancement facilities from Canara Bank totalling Rs 330 crore from August 2006 till March 2012. With continuous defaults, the bank declared the DCHL loan as non-performing asset in September 2012. It was also alleged that the company was trying to sell away the properties that were mortgaged to the bank. Interestingly, just a month before Deccan Chronicle was found fibbing about its assets, agencies like CRISIL were giving it high investment rating.
In mid-February last year, bank accounts of Sahara Group chief Subrata Roy and two Sahara Group firms were ordered to be frozen by SEBI. Immovable properties in the name of Subrata Roy were also attached. The market watchdog took these steps after being prompted by the Supreme Court, whose repeated instructions to Sahara Group firms for depositing the more than Rs 24,000 crore for refund to investors were ignored. The point that was not raised was what the SEBI and the RBI were doing all these years when “various illegalities” were being committed in raising of these funds from ordinary people who thought their interests were safeguarded by the two regulators.
The cases of Kingfisher Airlines, Deccan Chronicle Holdings and Sahara show how credit lines were extended even when they were bleeding and there was no prospect of them returning the money. All three companies are now engaged in a slew of legal battles filed by creditors.
However, such high-profile cases constitute only the tip of the iceberg. The combined debt of the top 10 business groups in India grew over five times in the past five years, from Rs 99,300 crore to Rs 5,39,500 crore. Indicating a trend of the times, when the likes of Adani, GMR and Vedanta were piling on debt, they were furiously acquiring assets all over the world. Adani bought mines in Southeast Asia and Australia, GMR was building the Malé airport in Maldives (where it acted most irresponsibly, leading to the cancellation of the contract) and Vedanta was busy snapping up companies everywhere. The total debt of these ten groups accounts for 13% of the bank loans, while the total volume of highly risky (from the standpoint of lending banks) corporate debt runs into Rs. 3.6 trillion.
All that Glitters...
So, from the plummeting rupee to the stressed banking system, trends are alarming indeed. But has not the Sensex been doing reasonably well despite the slowdown? Well it is, largely due to the cheap credit and easy money policies in vogue in the developed economies, which prompt investors to raise money at home at near-zero interest rates and use part of that to make portfolio investments in emerging economies at a much higher rate of return. So the Sensex remains high – before the world crisis, most of the time it was hovering around 20000, and following a steep but brief decline has been fluctuating in the 15000-20000 range since June 2009. But that does not in any way indicate strong fundamentals in the Indian economy, as we have seen above and shall see in the pages that follow.
So, the glittering Sensex notwithstanding, it is a stubborn and all-pervasive stagflation that the Indian economy finds itself in. Where has all the growth gone and why? A very pertinent question, it begets another: where did it come from and how? The stock official answer, and the reigning consensus among establishment economists, is that the high growth rates of recent years resulted exclusively from the grand bold restructuring initiated in 1991 (and can be restored by more daring reforms now).
Is it really that simple? Well, let us investigate.